|
Principal Components
Analysis
PCA (Principal Components Analysis) is one of the most widely used multivariate
techniques. For multivariate data, it helps visualisation by
finding combinations of the
original variables which best
represent the variation in the data.
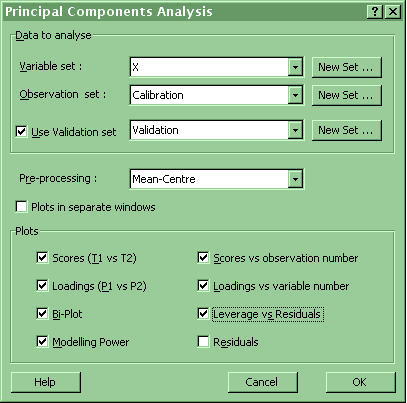
Chemetrica provides a very flexible implementation of PCA
and the dialogue box with the various options is shown
below:

Chemetrica has a wide range of options in its PCA
routines:
-
Analysis can be based on the covariance matrix (mean-centred
values), the correlation matrix (autoscaled values) or a
simple cross-product matrix (no scaling or centring)
-
Malinowski model functions IND, RE, IE and F-tests for
eigenvalues
-
Scree plot output
-
Hotelling T2 and Rao tests for outliers
-
A separate validation set can be used to select the
number of principal components in a model, with PRESS
plot.
-
Sample residuals and leverage for determining
influential or badly-modeled observations
-
Bi-Plots to relate variables and observations
-
Modelling power, which shows which of the original
variables are the most important
for the principal
components model
Bi-Plots show both scores and loadings. The scores
represent the observations, and the
loadings represent the
variables, so the bi-plot shows how variables and observations are
related.
PCA models work by only selecting the first few principal
components. The sample
residual shows how much error is
introduced by only selecting some of the principal
components. The leverage shows how much influence each observation has on the
model. Combining these two measures
shows observations where the model may be
poor, which have
the most influence on the model, and finally, observations
with both
high sample residual and high leverage may be outliers which have strongly distorted the model, and should
be further examined.
Return to the Chemetrica features
page. |